Histogram
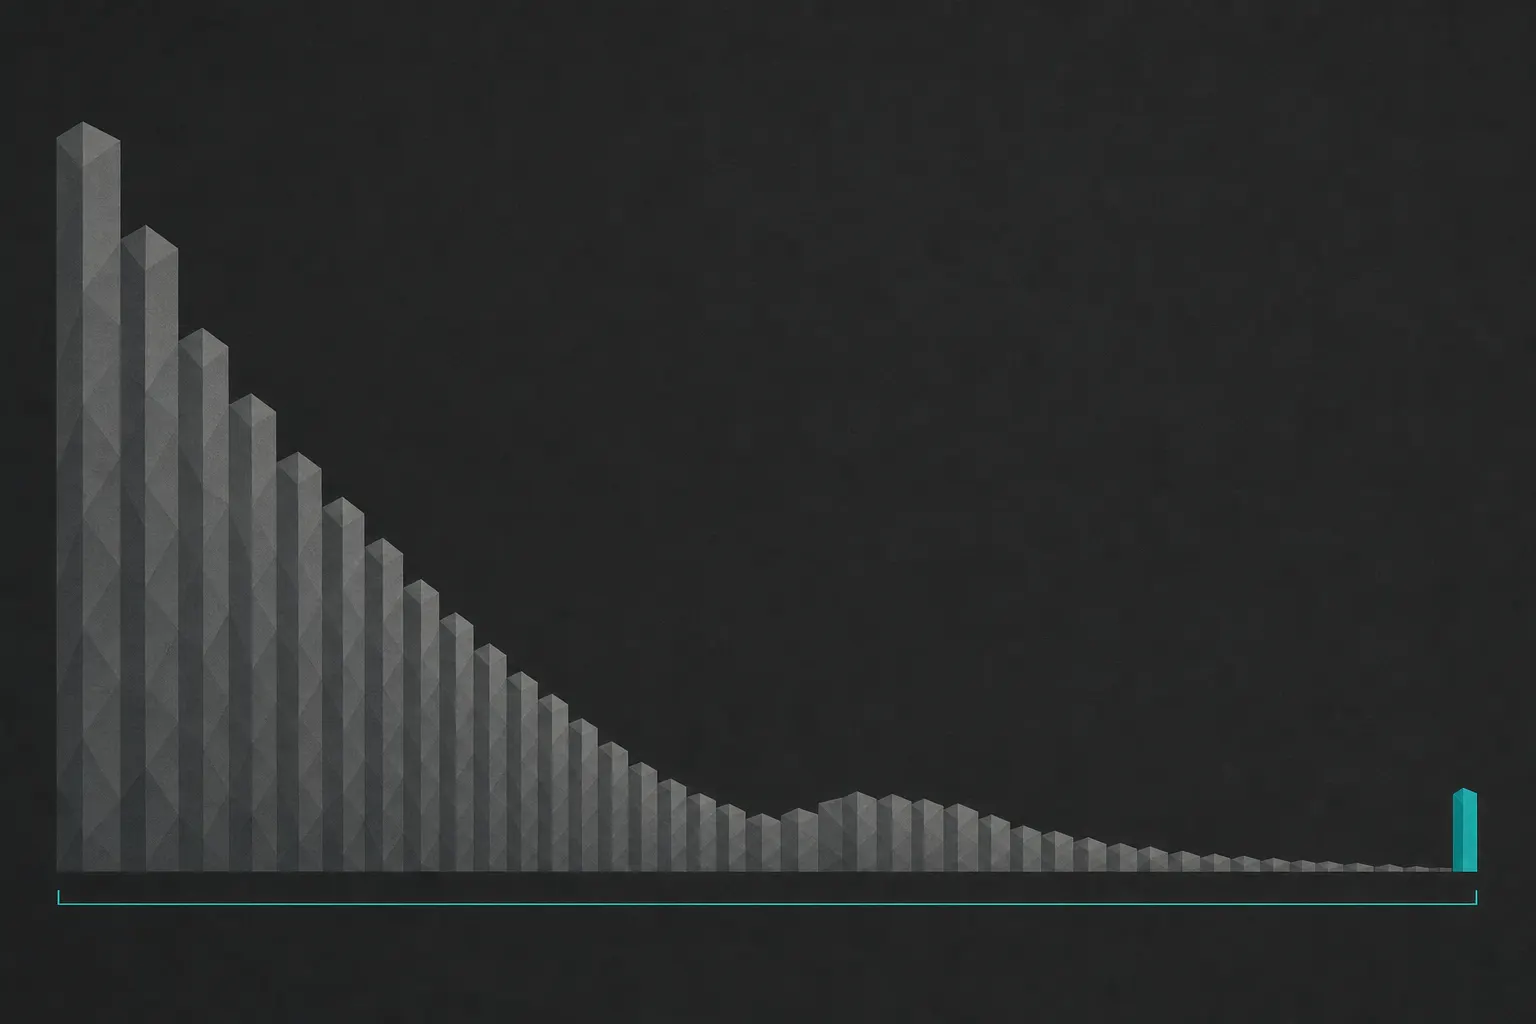
The camera's bar chart of tonal population: how many pixels sit at each brightness from black to white.
FinalFrame valuta ogni foto da 0 a 10: un 6 è competente, un 8 è degno di un portfolio e un 9 è di livello espositivo. Come funziona il punteggio
Cos'è davvero
The histogram is the only display on the back of your camera that tells the truth. It is a bar chart of tonal population: the horizontal axis runs from pure black at the left wall to pure white at the right, every pixel in the frame is sorted onto that scale by its brightness, and the height of the graph at any point is a count (how many pixels sit at that brightness). Shadows pile on the left third, midtones in the middle, highlights on the right. Height means how many, and only how many. It has never once meant how much they matter.
Two things the graph is not, and both misreadings cost photographs. It is not a map. The histogram counts pixels without knowing where they are or what they show: a face and a wall at the same brightness are the same bar, and a subject that fills a small fraction of the frame is a sliver in the count, nearly invisible under whatever the background is doing. It is a census of tones, not a picture of the picture. And it is not a grade. There is no correct histogram shape: no bell curve to aspire to, no centered mound that means "well exposed." A night street should pile hard left, because the scene is dark and the file should say so. Snow, fog, a white-on-white still life should pile right. A silhouette throws two mountains against opposite walls with a valley between them, and that is the shape of that picture done properly. The scene dictates the shape; the graph only reports whether the file agrees.
What it replaces is the least trustworthy display you own: the picture on the LCD. The screen's apparent brightness swings with the sun over your shoulder and the brightness setting you forgot you changed: the same file looks underexposed at noon and radiant at midnight. The histogram does not move with the sun. It is a measurement where the screen is a mood, and learning its grammar takes about an hour. Trusting it over the pretty picture takes most photographers years.

Generata dall'AI
Perché un 6 non è un 8
The difference is not in the graph: it is in the direction of the conversation. The photographer at a 6 reads the histogram as a verdict: centered means pass, a wall touched means fail, and the exposure gets corrected until the graph looks the way histograms are supposed to look. That obedience fails in two directions at once. The night alley gets brightened until the mound sits respectably in the middle, and the night is gone, a grey dusk nobody stood in. Or the fear of the walls goes so deep that no frame ever touches either one: every histogram tucked politely inside, every black slightly milky, every white slightly grey, a whole catalogue of frames with no anchor because the graph was never allowed to report a committed tone. Both are the same mistake: the shape was obeyed instead of the scene.
The photographer at an 8 has reversed the conversation. The scene was read first: this frame is dark, and it should say so; this dress must hold texture; that sun-glint was always going to be white, and the histogram is then asked a question it can actually answer: did the tones land where I sent them? The night frame's left-piled mass is confirmed, not corrected. The mass is pushed right on a RAW frame with room to spare, deliberately, knowing it comes back down in post. One wall is touched on purpose and the other interrogated. Show that histogram to someone who never saw the scene and they might wince (off-center, wall contact, nothing a rulebook would bless) and the frame is right, because the shape answers the scene. That is the whole distance: a 6's exposure reads as the graph's opinion, faithfully obeyed. An 8's histogram is a receipt for a decision made somewhere else: in front of the camera, by the photographer, on purpose.
Prima dello scatto
Three questions per glance, and the glance costs two seconds.
Where does the mass live? Match it against the scene's truth, not against an ideal: a dark scene's mass belongs left, a bright scene's right, an average scene in the middle. Mass sitting somewhere the scene doesn't justify means the meter made a decision you haven't ratified: usually its favorite one, dragging everything toward the middle.
What is happening at the walls? A slope that runs off the edge mid-climb means clipping: tones pushed past what the file can record, all of them stacked into the last bar, detail flattening into pure white or pure black. A thin spike touching the right wall is usually just the speculars (sun-glints, chrome, a bare bulb) tones that were always going to be white and hold nothing to lose. A broad mass jammed against it is diffuse detail dying: cloud structure, fabric, skin. The graph shows the difference in shape; learn to tell a spike from a pile-up and half of exposure review is done.
What is missing? An empty gap at either end means the range went unused: no true black, no clean white, the flat frame with no anchor. An empty middle with mass at both walls means the scene is wider than one exposure wants to hold, and a decision is due, not a nudge.
Then the load-bearing caveat, because the instrument has a bias built in. The in-camera histogram (and the blinkies, the flashing clipped-highlight warning) are computed from the JPEG preview the camera bakes for its screen: picture style, contrast curve, and white balance already applied. They are not read from the RAW data you are actually recording. The JPEG clips earlier than the RAW does, so the graph cries wolf ahead of the file: a highlight the warning flags as gone often still holds texture in the RAW, commonly around a stop of slack, camera-dependent. That slack is real and usable, and unmeasured until you test it, once, on your own body (the highlight-recovery lesson's assignment measures it properly). A flat, neutral picture style narrows the lie for everything the screen shows. And if you shoot JPEG, note the inversion: the preview is your file, so your histogram doesn't lie at all (the caveat is a RAW shooter's problem and a RAW shooter's slack).
Last, pair the graph with the blinkies, because each has exactly what the other lacks. The histogram is a census with no addresses: it says how much is clipping, never where. The blinkies are all address: they flash on the clipped region itself. So the reflex is a two-step: wall contact on the graph, then blinkies to ask what is touching. Flashing on the sun's disc: ignore it and shoot. Flashing on the dress, the sky you came for, the bright side of a face: act, because the graph's census just found the address that matters. And when a strong color carries the frame (a red flower, a saturated sunset) flip to the per-channel RGB histograms if your camera offers them: a single channel can slam the wall while the combined graph reads safe, and the flower loses its petal texture with the histogram's blessing.
In fase di scatto
Chimp the graph, not the picture. After the first frame of any new light, one glance at the histogram (mass where the scene wants it, walls interrogated, spike or pile-up named) and then work the scene, re-checking when the light changes rather than after every frame. The LCD image is for composition review; the graph is for exposure review; keeping the two jobs separate is the habit this whole page exists to install.
When you shoot RAW and the scene's range fits with room to spare, put the slack to work: expose to the right. Push the mass toward the right wall until the brightest tone you need texture in sits just short of the clip, then pull the brightness back down in post. The reason is physics, not style: a brighter capture collects more light, and the noise you are fighting lives in the darks; shadows banked high come down clean, shadows starved and lifted come up as grain. The histogram is the instrument that makes the move safe: "just short of the wall" is a thing you can see, where "a bit brighter" is a guess. And know when not to bother: when shutter and aperture are already committed to motion or depth, when the scene fills the range with nothing to spare, or when you deliver JPEG (there the render is the file, there is no pull-down coming, and the honest exposure is the one that looks right).
Trust the blinkies for location, always: they are the only tool on the camera that points at the clip. Trust their threshold only as far as your file format deserves: at face value for JPEG, minus your tested stop of slack for RAW. Blinkies on a tone you need means act: exposure down, a graduated filter, a bracket. Blinkies on a specular means leave it; protecting a tone that was always going to be white spends the whole frame's exposure on nothing.
And let the graph tell you which job you are on. Mass climbing both walls at once means the scene has beaten the sensor: no placement fixes a fit problem, and the forks from there (bracket, grad, wait for the light) belong to the dynamic-range lesson. The histogram cannot make that decision for you. It is the instrument that tells you, before the shutter, that a decision is due, which is the most valuable sentence a graph ever says.
In post-produzione
The editor's histogram is a different instrument, and a more honest one: it is drawn from the file you actually shot, rendered through your current settings, and it updates live with every slider. No baked picture style, no guesswork: this graph and your file agree by construction.
Two jobs at the desk. First, the truth test on a suspect capture: drag the highlight slider down and watch the right wall. Mass that slides back off the wall and resolves into texture was retained: the camera's graph cried early, exactly as the caveat predicted. Mass that stays pinned however far the slider travels is gone in the file: all channels at the ceiling, nothing recorded, and darkening it makes grey, not cloud (the boundary the highlight-recovery lesson maps in full). The same test runs at the left wall, where what comes back from deep shadow arrives with noise on its back. Second, the graph is the meter for every tonal edit you will ever make: set the black point by watching the left wall (touch is an anchor, a pile-up is a crush) set the white point at the right, and use the editor's clipping previews to get the one thing the graph still lacks, the address.
One tell the desk graph shows that the camera's never will: the comb. Stretch a file with little tonal information (a JPEG pushed hard across a wider range than it holds, a thin capture forced open) and the histogram develops gaps like missing teeth: tones pulled apart with nothing left between them. On screen that arrives as banding in the smooth gradients, the sky stepping instead of rolling. The comb is the graph warning you before the sky does; when it appears, the file is telling you its information ran out before your ambition did.
The honesty clause is short, because the desk graph's honesty is the point: it reports what the file holds, and it cannot add to it. For a highlight driven past the ceiling, or a shadow that never rose off the floor, the editor's histogram is a coroner: precise about what died, useless for revival. The version of this instrument that could have saved the frame was the one on the back of the camera, read in the two seconds after capture, when the reshoot cost nothing. That is why this lesson's center of gravity sits at the camera: the desk graph tells the truth about what you have; only the capture graph can change what you have.
La scala
- Beginner: judges exposure by the LCD. The picture looks bright enough or it doesn't; the histogram goes unread, or is read as a grade with "centered" for a passing mark. Good night frames get brightened, good snow frames get darkened, and sunny-day review deletes keepers the screen slandered.
- Competent: reads the walls. Clipping is recognized, the blinkies are on, the important highlight gets protected. But the centered mound is still the quiet goal, so low-key and high-key scenes keep getting corrected toward grey: the walls are read, the shape is still obeyed.
- Strong (the serious amateur's working level): reads the shape against the scene. Knows there is no correct histogram; can say where the mass should sit before raising the camera; tells a specular spike from a diffuse pile-up at a glance; exposes to the right when RAW and the scene allow it; and knows the graph is a JPEG's opinion, with the tested slack to prove it.
- Advanced: the graph as confirmation, not discovery. Per-channel read is reflex when color carries the frame; the census-not-a-map limit is internalized, so the blinkies get interrogated on the subject, not the sky; and the histogram is glanced at rather than studied, because the placement was a prediction, and the graph's job is only to agree.
Vai a scattare
Find two scenes that are honest tonal opposites. One genuinely dark: a night street, a dim interior, a dark subject on dark ground. One genuinely bright: snow, fog, sand, a white wall in soft light. Before every frame, predict the histogram out loud, say where the mass should sit if the file tells this scene's truth, because prediction is the skill this drill trains; checking is just the scoring.
Shoot each scene twice, changing only exposure. First the meter's zero, untouched. Then the placed frame: dial exposure compensation until the graph agrees with your prediction (the night's mass pushed left where it belongs, the few real lights allowed their spike); the snow's mass pushed right until it sits just short of the wall with texture held, blinkies interrogated on the subject, not the specular. Four frames total.
Read the results as a pair of pairs. The two meter frames will look nearly identical on the graph (the same respectable centered mound) and wrong on the screen: grey night, grey snow, two opposite scenes flattened into the same average because the meter has exactly one opinion. The two placed frames will look opposite on the graph and true on the screen. That comparison is the entire lesson in four frames: the histogram has no favorite shape (the scene does, and the graph's only job is to report whether the file heard it). Then run one desk check on the placed bright frame: highlight slider down, watch whether texture returns from past where the camera's graph worried (your own body's slack, measured once, banked for every frame after).
Then close the loop. Send the placed frame from the scene nearer your usual work through a critique: a critique that names exposure as your bottleneck is reading exactly what this graph measures, whether that verdict is what routed you here or you arrived from the search bar. If the graph was read honestly and the placement was real, exposure should retire as the named limit, and the FinalFrame Score has room to move with the tones you placed. And if exposure is named again, that is information, not indictment, and it reads two ways, both already in your four frames. Either the wall was clean and the wrong tones were protected anyway: the census-not-a-map limit collecting its fee, a subject clipping while the graph read safe, which the blinkies on the subject would have caught; or the scene's range beat a single frame entirely, and no placement was ever going to fix a fit problem: that door is the dynamic-range lesson's, and the graph showing mass at both walls was already pointing at it. Both readings are worth four frames to own. The histogram never took a photograph: it only ever told the truth about one. The moved bottleneck, not the score, is the proof you listened.
Lezioni correlate
Vedilo sulla tua foto
Il modo più rapido per capire il punteggio è leggerne uno su uno scatto che conosci bene.
Critica una foto